

When I started consulting app developers, the biggest concern they usually shared was: “How much can my app really make by showing ads?” It is a justifiable question, especially when the product invested months of hard work. 2026’s answer is not only more promising but also more complex than just one number.
The whole mobile advertising industry has changed beyond recognition. It is expected that the worldwide in-app advertising market will reach $390 billion by 2025, which is a huge increase from just a few years ago. However, what does it imply for your app? Well, it is a few major factors upon which it will depend whether you earn a little or a lot of money from ads.
Estimating the True Revenue Potential
According to the industry experts, a mobile app that attracts 100,000 monthly active user could earn approximately $5,000 – $100,000+ monthly in ad revenue. The reason for such a broad range is that income depends on many other factors aside from the number of the users
That includes your app category, user locations, ad formats selected, and their implementation in the app, to name a few.
There have been cases when apps with fewer users generated more revenue than those with millions of users because they knew the audience well and made better monetization decisions. That is the secret of identifying the factors influencing the number changes up or down.
What Influences Your App’s Ad Revenue
These are the most significant factors that determine how much your app can earn from ads:
Location of Your Users Is the Major Factor
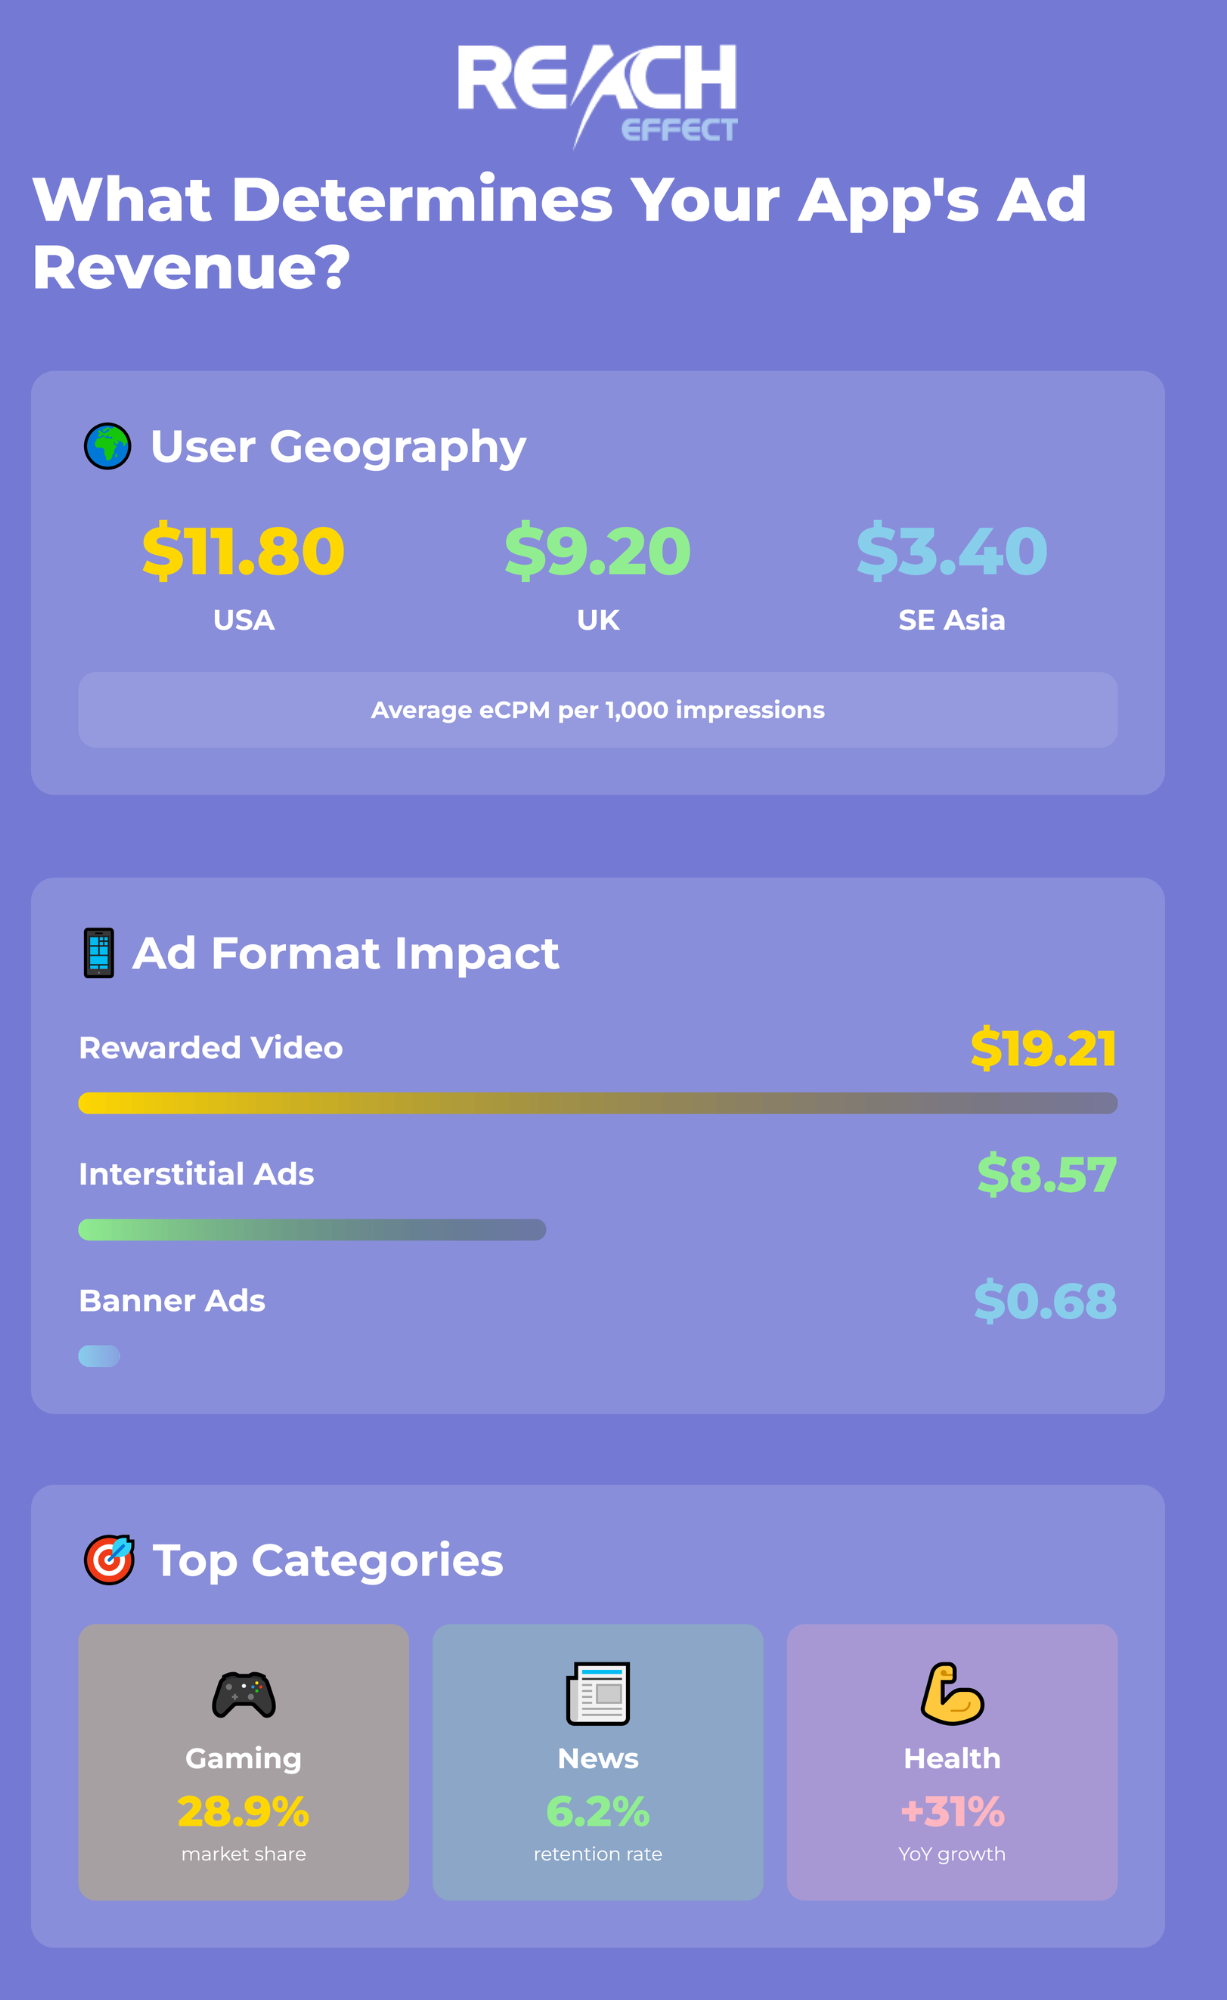
Different users generate different amounts of revenue. The average eCPM in the US is $11.80, while in the UK it is $9.20, and in Southeast Asia just $3.40. So, 1,000 ad impressions from US users will earn you almost four times more than the same number from Southeast Asian users.
It is not a reason for you to disregard the emerging markets. For example, when targeting users in Brazil, Vietnam, and India, growth trajectories of these markets are impressive. In Vietnam, there was a steep eCPM increase in 2024, with $2.34 in September for App Open ad format, indicating that these markets mature very quickly.
Ad Format Choice Makes a Huge Difference
The choice of ad formats probably matters most to your app’s revenue. So, you may look at different ad formats as different types of your monetization arsenal. Each one is there for different reasons and brings different amounts of revenue.
Rewarded video and interstitial ads are the main source of revenue because they get the user’s attention and engagement to a great extent. These full-screen ads disrupt users experience just for a short period, which is why advertisers are willing to pay premium prices for them.
Here is the breakdown of the eCPM by ad formats in the US:
The highest performing ad format are rewarded video ads. They generated an eCPM of $19.21 for Android apps. They are also ideal for gaming apps, where users voluntarily accept to watch ads in exchange for in-game rewards, so it is a win-win for everyone.
The silver medal goes to interstitial ads. Interstitial ad prices were at $10.78 in Japan, while the US market reached $8.57. These are full-screen ads that show up at natural transition points in your app.
Banner ads continue to be a reliable source of income, even though their per impression revenue is lower. Since they are less intrusive, they can be run continuously throughout the user’s session. The average eCPM for US Android banner ads is around $0.68.
Your App Category Affects Monetization Results
Each app category attracts different levels of advertisers’ interests and user engagement. Since games are one of the first entertainment mediums for the users, game users stay longer leading to higher conversion rates for advertisers. In 2024, games were the biggest revenue source, with a market share of 28.9%.
News and media apps are not far behind. News apps are number one with retention rates at 6.2%, which is higher than the second-best industry. This means more chances to show ads and make money.
Health and fitness apps continue to expand their user base. These are the non-gaming apps that have shown the highest rise in revenue with a 31% increase YoY as users regularly get engaged with workout routines and use health tracking features.
How the Numbers Really Work
eCPM (effective cost per mille) helps you understand your earning potential. It indicates how much money you can make for one thousand ad impressions served through your app.
Formula is simple: first, take the amount of revenue generated by advertisements then divide this number with the total number of impressions. Finally multiply that figure by 1000. Suppose your app has made 700 dollars in a day with 200,000 impressions, the eCPM is 700/200000*1000=3.5 dollars. In other words every 1K impressions bring $3.50.
However, each user’s exposure to impressions significantly depends on how you design your app and users’ activities. A typical game can see 20-50 ads per user per day but a utility app might yield only 3-5. And this is where planning and strategy play a vital role.
Creating an Accurate Revenue Forecast
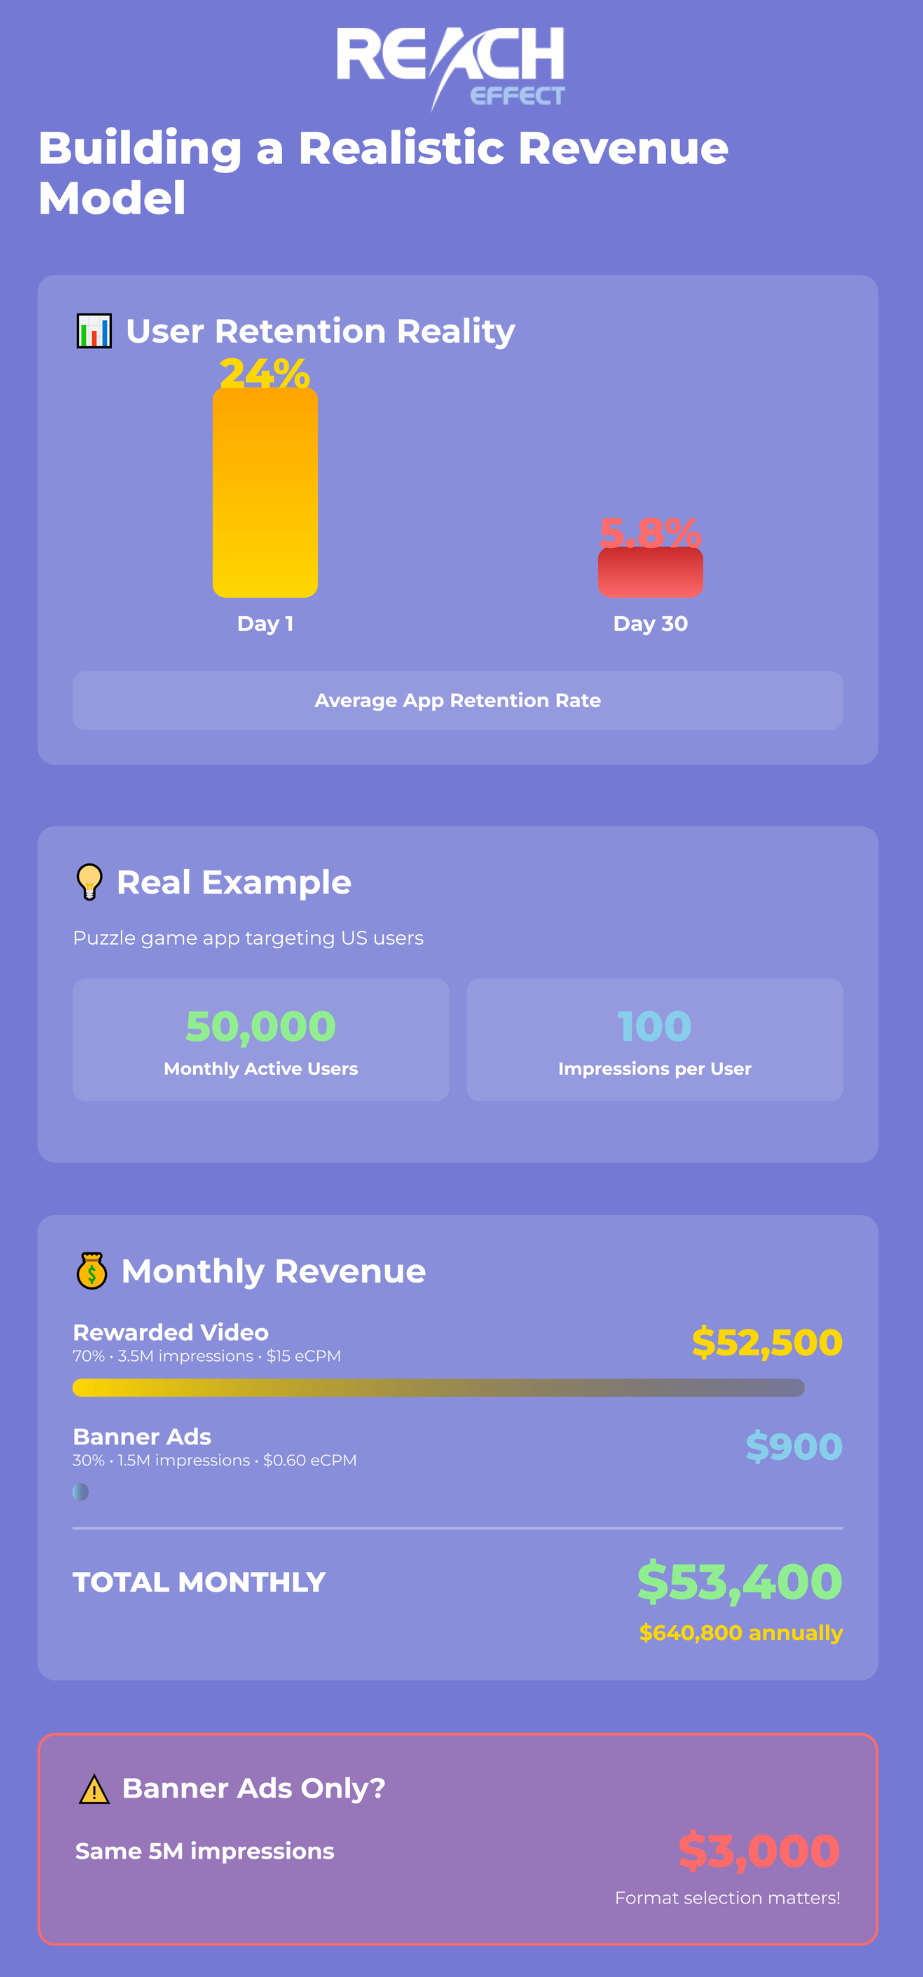
Besides, engagement metrics should be the first consideration when developing your app monetization plan. For instance average retention rate for apps is approximately 24% on Day 1 and it falls to 5.8% by Day 30 meaning that alongside acquiring users you also have to focus on keeping them engaged.
Consider this hypothetical scenario: You are launching a puzzle mobile game aimed at US users. Your 50,000 monthly active users average 100 ad impressions each month. You mix two advertising formats: banner ads and rewarded video.
Below is a breakdown of earnings if 70% of your impressions come from rewarded videos that you sell at a rate of $15 eCPM and the remaining 30% from banners which bring you $0.60 eCPM on average:
Monthly impressions 5,000,000; rewarded video impressions 3,500,000 earning $52,500 and banners 1,500,000 earning $900. Total monthly revenue is $53,400 which translates into approximately $640,800 annually.
This case highlights why selecting the right ad format may be the chief factor. On the other hand, assuming you turned exclusively to banner ads, those same impressions would amount to the monthly revenue figure of only $3,000.
The Growth Trajectory for 2026 and Beyond
As much as 82.3% of all mobile ad spending will be on in-app advertising by 2026, indicating over 126% growth in five years. More advertising dollars competing for your inventory due to this huge shift towards in-app advertising will normally push the rates up as the demand rises.
Video content is rapidly taking over the share. The statistic states that by 2025, 85% of all consumer internet traffic will be from video, which is excellent news for app developers as video ads are very lucrative.
Regional markets are changing at various times. The APAC in-app advertising market is forecasted to be the quickest at a CAGR of 14.3% during 2025 – 2033 while the other markets are expected to be laggards. The growth will be attributed to more smartphones penetrating the market and digital consumption increasing.
Maximizing Your Revenue Without Hurting User Experience
Figuring user experience first before placing advertisements is what most developers fail at, in my opinion. Irritating the users with too many advertisements may increase the revenue for a day, but it will damage the retention rate leading to lesser profits in the end.
The apps that do very well show ads when the users are ready for them naturally. A fitness app, for example, can show ads during the interval between two workout sessions. A news app, on the other hand, can show an ad between two news stories. A game can put an ad on the screen when a level is completed by the user.
Rewarded video advertising is one of the best and most respectful ways to achieve good customer engagement. It registers a 91% completion rate alongside a 43% higher click-through rate when compared with static banners. This is because the users themselves choose to watch this kind of ad. It is this voluntary engagement that not only creates better experiences for users but also produces greater results for advertisers.
Experimentation with different approaches is a must. Constantly test ad frequencies, placements, formats, etc. In addition to tracking revenues, also keep an eye on the user retention metrics. For instance, you cannot say that you have made good money by getting an extra $500 per month from aggressive ads if you have lost your 20% user base.
Platform Considerations: iOS vs Android
The decision on the platform is going to have a big impact on how much you can potentially make. Android is expected to take a majority share at 67.3% in the market revenue of 2024, which is quite logical considering that the Android platform has a larger global market share especially in the emerging markets.
On the other hand, iOS users have always attracted higher eCPMs and it is because they usually have more purchasing power. However, the difference has become less significant with the introduction of privacy changes, but a developer’s location is still more important than the platform when it comes to the majority of developers.
Hybrid Monetization Strategies
Some developers use multiple ways to make money. An average subscriber to a subscription app generates 4.6 times the revenue of a user who only views ads. More than 60% of top-grossing apps use hybrid monetization strategies combining ads, in-app purchases, and subscriptions.
This strategy is effective because it offers users different options. Some users may choose to watch ads in order to have free access to content. Others may opt to pay a fee to remove ads entirely. Power users may subscribe for premium features. Providing multiple avenues of value capture more potential revenue.
At Reacheffect, we help advertisers to grasp the importance of these dynamics and fine-tune their marketing strategies across different mobile platforms. Whether you are a developer looking to monetize your app or an advertiser eager to effectively reach mobile users, grasping these revenue-related issues is vital.
Looking Ahead: What to Expect
The in-app advertising path is set to be prosperous. It is expected to register an annual growth rate of 7.88% resulting in a total market size of $569.95 billion in 2030.
Privacy regulations are continuously affecting the market, yet instead of hindering opportunities, they are encouraging the industry to explore better methods. Advertisers now are able to efficiently target relevant audience segments using contextual targeting and first-party data sources, without the need of invasive tracking.
Therefore, the basic principles are even more important than ever for app developers. Apps development, engagement, consistent app usage, carefully choosing of ad formats and prioritizing user experience outweigh all efforts of aggressively monetizing every single penny.
In reality, the level of the app revenue from advertisements in 2026 will be largely determined by your efforts. There is a huge and ever-expanding market opportunity awaiting you. Basically, your performance decides your position within the spectrum.