Click through rate benchmarks by industry are a necessity for digital marketers to be able to gauge the effectiveness of their campaigns and optimize their performance. These benchmarks are like the main performance indicators that show companies how well their advertising is doing when compared to other businesses in the same industry.
Click through rates are the percentage of people who actually click on your ads after seeing them. This metric is a great way to tell if your campaigns are hitting the spot with target audiences and if your creative content is really getting people to take action.
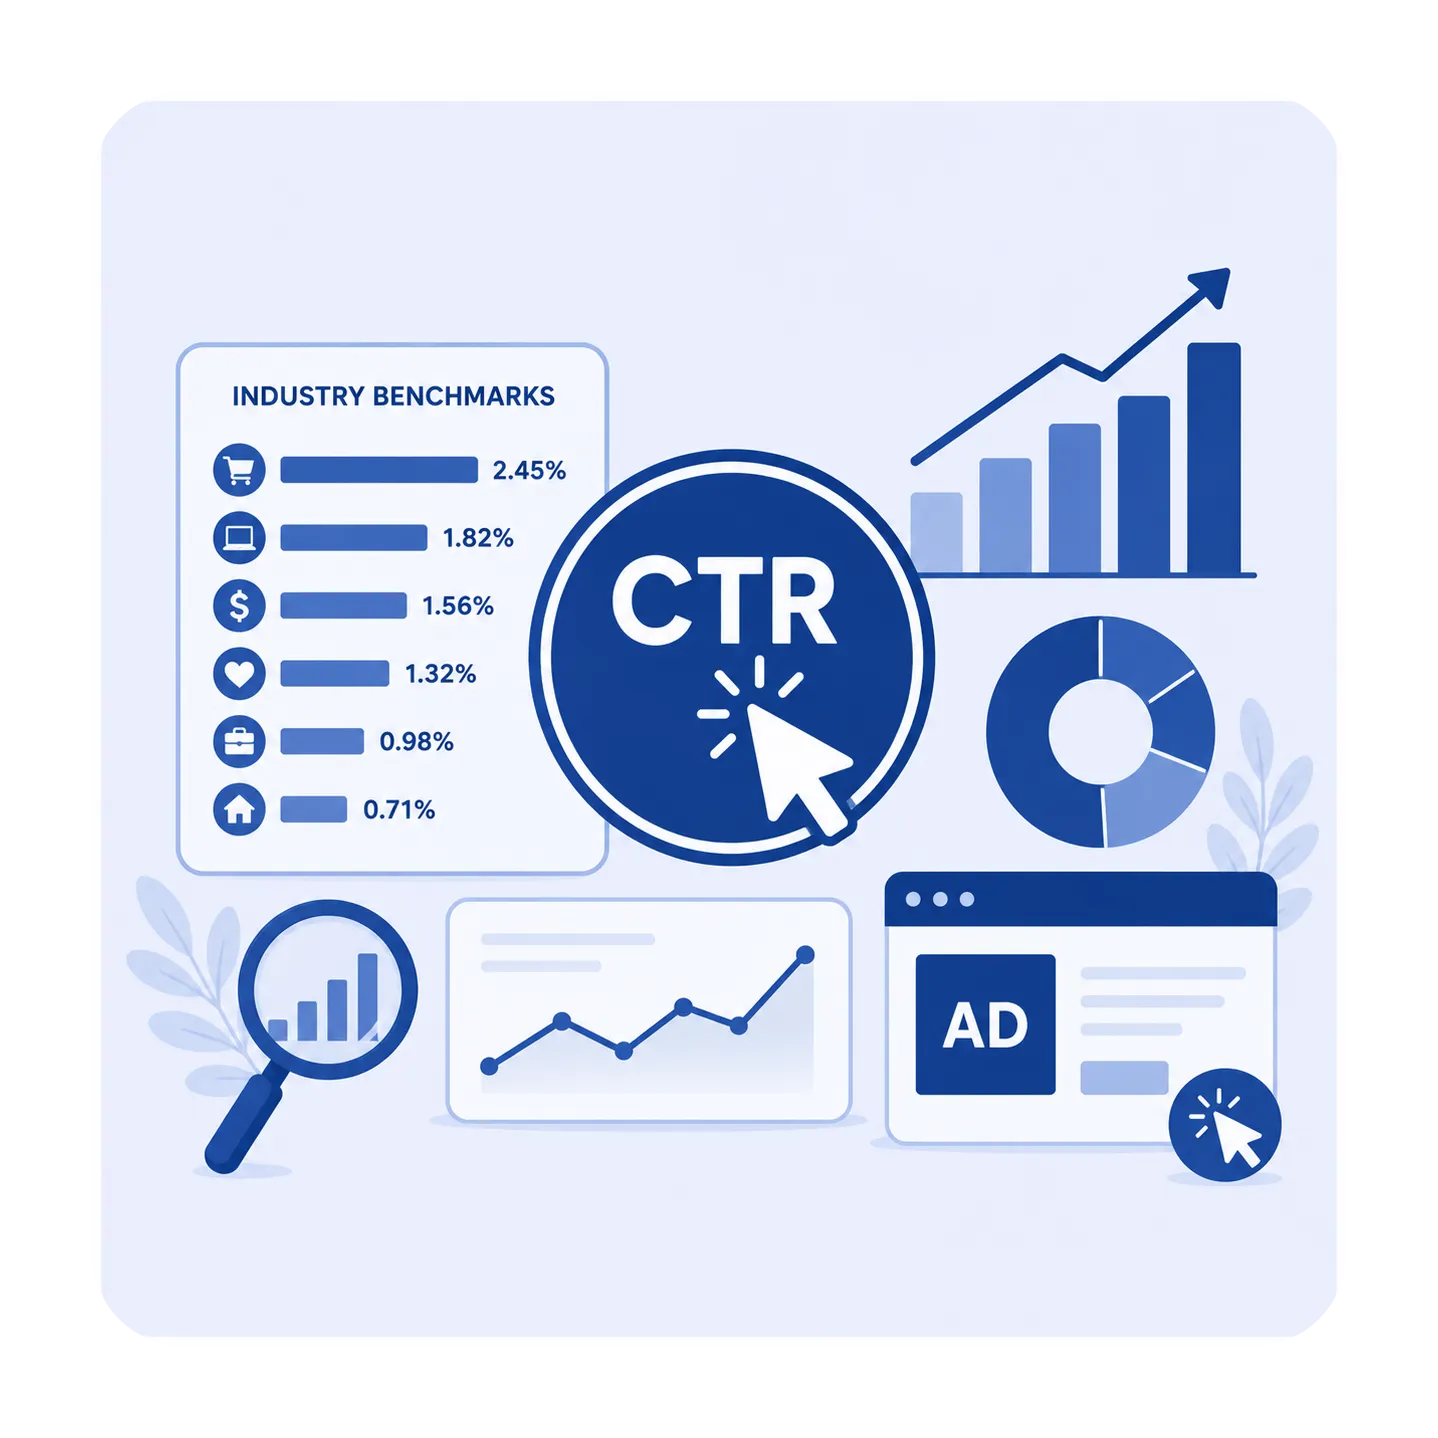
Definition of Click Through Rate Benchmarks
Click through rate benchmarks are the average performance that is generally accepted across industries and advertising platforms. They can be used by marketers to find out if their campaigns are doing better, worse, or the same as the average level within the industry.
Other than the primary industry, a lot of different factors affect the variations of the industry benchmarks such as the properties of the platform, different consumer behavior towards the target audience, and the competition levels. As an example, healthcare advertising generally experiences different involvement scenarios compared to retail or technology sectors.
Being familiar with these benchmarks helps marketing departments to set achievable targets, discover areas for improvement, and make better decisions regarding campaign and channel budget allocation.
Click Through Rate Benchmarks by Industry Summary Table
| Industry | Email Marketing CTR | Search Advertising CTR | Social Media CTR | Display Advertising CTR |
|---|---|---|---|---|
| Retail/Ecommerce | 2.5% – 3.2% | 3.5% – 4.8% | 1.8% – 2.4% | 0.8% – 1.2% |
| Healthcare | 2.8% – 3.5% | 3.2% – 4.2% | 1.9% – 2.6% | 0.7% – 1.1% |
| Technology | 2.1% – 2.8% | 2.8% – 3.8% | 2.5% – 3.5% | 0.6% – 0.9% |
| Financial Services | 2.0% – 2.6% | 2.5% – 3.5% | 2.2% – 2.9% | 0.8% – 1.3% |
| Education | 2.7% – 3.4% | 3.0% – 4.0% | 2.1% – 2.8% | 0.9% – 1.4% |
| Legal Services | 2.3% – 2.9% | 4.5% – 6.2% | 1.7% – 2.3% | 0.7% – 1.0% |
| Travel/Tourism | 2.4% – 3.1% | 3.1% – 4.1% | 2.0% – 2.7% | 0.9% – 1.4% |
Email Marketing Click Through Rate Benchmarks by Industry
Email marketing is still one of the most powerful channels for digital marketing as evidenced by the click through rate benchmarks that vary significantly for different industries.
Retail industry by and large through email marketing find click through rates around 2.5% to 3.2%, which in general indicates that customers are attracted to promotional contents and notification of new products. Apparel and fashion companies typically experience a bit higher click through rates since their content is visually appealing and regular seasonal campaigns.
The healthcare sector on average emails click through rates of 2.8% to 3.5%. This sector performs at the top due to valuable and priority healthcare communications recipients are ready to open.
Most technology enterprises reach email click through rates between 2.1% and 2.8%. Although technology lovers are very engaged, their inboxes are flooded with adverts so it impacts the performance.
Financial institutions generally have 2.0% to 2.6% click through rate via email. The necessity of using professional language in financial communications and regulatory constraints might affect the levels of engagement.
Education email marketing campaigns usually perform well and report click through rates from 2.7% to 3.4%. Since educational materials, to a great extent, provide recipients with significant, long-lasting value, engagement is driven strongly.
Search Advertising Click Through Rate Standards
Search advertising standards offer valuable clues to pay-per-click marketers on different ways of employing their budgets most effectively depending on various industries.
Retail and ecommerce industries attract search advertising click through rates at around 3.5% to 4.8%. This is partly due to purchase-oriented nature of retail search queries driving these higher levels of performance.
Healthcare search ads bring the click through figures in the range of 3.2% to 4.2%. The extent to which many healthcare-related searches may happen, paired with their urgency, may make consumers more willing to engage with advertisements that are relevant.
Legal services can boast excellent click through results in the search area ranging between 4.5% and 6.2%. The users searching for legal support are typically driven by high-stakes issues, so they are motivated to click on the advertisements that match their queries.
Technology sector tends to generate search click through rates within 2.8% to 3.8%. Going beyond the competitive aspect, tech companies are able to benefit from sharply focused search queries, which can lead to quality traffic.
Financial services normally achieve search advertising click through rates in the range of 2.5% to 3.5%. The complicated nature of financial products and decision paths that are extended can have an effect on the immediacy of clicking behavior.
Social Media Advertising Performance Benchmarks
Every social media platform has its unique set of benchmarks when it comes to click through rate by industry, reflecting the mix of platform features and user behavior patterns.
Facebook ads the retail sector normally produce click through rates from 1.8% – 2.4%. The product pictures in retail marketing fit well Facebook’s format and the way users interact with the platform.
Instagram click through rates for fashion brands mainly fall within 2.1% to 2.8%. Because Instagram is all about visuals lifestyle and fashion advertising works particularly well there.
LinkedIn advertising is a true B2B powerhouse when it comes to engagement metrics: technology companies for instance often see their click through rates soar from 2.5% up to 3.5%. This higher interaction rate is a result of the heavy business orientation in the side context.
When it comes to Twitter, click through rates can vary greatly from one industry to another. The media and entertainment companies usually manage with rates approximately falling between 1.5% and 2.2%. Being the real-time platform, Twitter is more suitable for issuing breaking news and for trending content.
Display Advertising Industry Benchmarks
Display advertising industry-based click through rates benchmark are a reflection of both challenges and opportunities that come with visual advertising across the entire web.
Retail display ad campaigns usually lead to click through rate of 0.8% to 1.2%. Although these rates are much lower when compared to search Click-Through-Rates, advertisers see display ads as a way for presenting their brand visually and from the retargeting perspective.
Travel industry advertising on display sees click through rates between 0.9% and 1.4%. Nature of travel content is both aspirational and very engaging, especially when people are in planning mode.
Technology display advertising usually results in a range from 0.6% to 0.9%. The primary reason is that most tech products serve businesses so buying decisions in big companies take a long time. Therefore the general trend is that such ads do not generate instant clicks.
Healthcare display advertising at present record click through rates between 0.7% and 1.1%. Since healthcare is a delicate topic, it is actually necessary to carry out very targeted and well thought-out messaging for driving responses.
Factors Affecting Industry Click Through Rates
Many aspects explain why click through rates vary from one industry to another as well as ones between different campaigns and within the same sectors.
The make-up of the target audience plays a big role on the final click through rates. Industries where needs are urgent usually get the highest levels of participation while those which are geared towards long-term considerations are seen to be the least performing. Knowing your target audience’s behavior is the best way to tailor a winning campaign.
The intensity of rivalry among players within a sector profoundly affects benchmarks. For instance, those sectors where players are quite active may show very low click through rate figures for every ad because there will be a lot of ad competition and the target audience will be saturated.
Seasonal changes are a very important factor leading to changes in industry benchmarks throughout the year. For example, the retail industry experiences large holiday season spikes whereas B2B sectors see a drop in summer months.
Advertisement quality and relevance are the major factors determining click through rates across industries. Well-targeted, compelling creative content usually beats generic messaging, irrespective of industry benchmark.
Where there are platform algorithms and features, these will play an important role influencing click through rates. Thus, knowing the particular characteristics of each platform is the key to the best campaigns able to meet performance based on industry standards.
How to Use Industry Benchmarks Effectively
When you involve click through rate benchmarks by industry, the first thing is to think strategically and analyze thoroughly your unique situation.
The first step is to determine your main industry category and the typical range of a benchmark there. Based on this, you will be able to compare your current performance, identify areas for improvement, and set realistic goals for yourself.
While applying industry benchmarks, you must also take into account the characteristics of your target audience. Some market segments within the wider industry may have different performance than those reflected by the averages.
It’s also a good idea to measure your performance over various timeframes as seasonal changes and new campaigns usually have different effects on your results. In fact, short-term movement is typical, whereas a continuous underperformance means that optimization is necessary.
Don’t treat benchmarks as your final goal. Your distinct value, your audience and your competitive status might be such that you justify performance above or below the industry’s average.
Administrative data and industry benchmarks taken together present a robust basis on which to develop the most accurate expectations. In fact, your historical data often yields the best insights.
Conclusion
Click through rate benchmarks by industry are very helpful for planning campaigns and for marketing teams looking for areas of greatest potential impact. Besides budgets and creativity, knowledge of these benchmarks results in better targeting strategies and more effective decision-making in the marketing corner.
Do keep in mind that a benchmark is nothing more than a starting point on the path to success. It is possible to go far beyond the benchmark performance levels by means of optimization, continuous testing, and understanding of target audiences.
Success is a matter of balancing knowledge of the industry, with your own unique business characteristics, and understanding audience needs. Use benchmarks to get an overall picture but develop strategies that reflect your unique market position and growth objectives.